- Historical development of the world's population (page 46 of your book)
- Current demographic trend (page 46)
- Demographic Transition Model. You can combine the contents on page 47 and the information posted in the blog.
- Natural movement of population: birth rate, death rate, infant mortality rate, general fertility rate, natural population rate.
- Population pyramids.
- Population density. Information I gave you in the class handouts and pages 48 and 49 of your book.
- Unite vocabulary.
Friday, November 25, 2016
POPULATION EXAM'S CONTENTS
What you must study for the Population unit's exam:

Thursday, November 24, 2016
Thursday, November 17, 2016

Wednesday, November 16, 2016
POPULATION PYRAMIDS

A population pyramid is one way to look at the demographics of a country.
Demographics are population characteristics, such as age, gender, race, religion, or language. A population pyramid looks at only age and gender. It is constructed to show how many people in a particular age group are male of female. This is done using a horizontal bar graph. The result is a clear picture of how a country's population breaks down according to gender and age, and where the most people occur according to those two piecws of information.
Tuesday, November 15, 2016
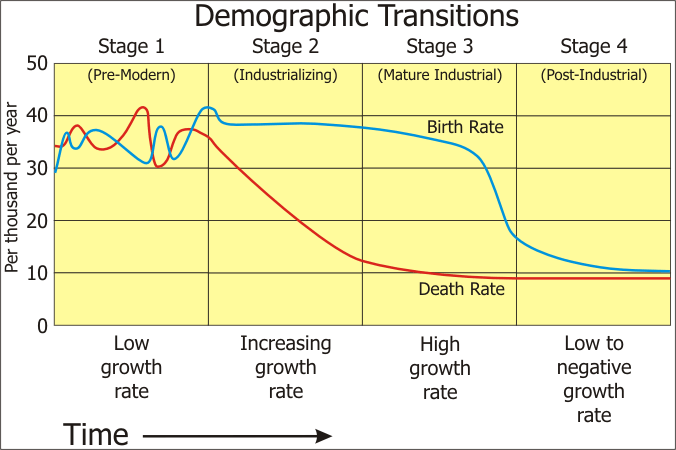
DEMOGRAPHIC TRANSITION MODEL
Population
change depends mainly on the balance between the birth rate and the death rate.
It is also affected by migration.
Throughout
history the world’s population has usually shown a natural increase. Exceptions
have occurred:
·
During times of disease (the bubonic plague in the
Middle Ages and the HIV/AIDS (Human Immunodeficiency Virus, the virus that
causes Acquired Immune Deficiency Syndrome) in present-day southern Africa.
·
As a result of war (western Europe during the two
World Wars and in present day in Afghanistan)
·
Due to recent improvements in family planning and
female education (either voluntary as in several western European countries or
enforcement as with China’s one-child policy).
Demographic transition model
The
demographic transition model shows the relationship between birth rates and
death rates. It describes how, over a period of time, a sequence of change in
population growth rates takes place. The model, which was based on population
changes in several industrialised countries in Western Europe and North
America, suggested that there were four stages through which all countries will
eventually pass.
Stage 1. Here both birth rates and death rates fluctuates at a
high level (about 35 per 1000) giving a small population growth.
Birth rates are high because:
- · No birth control or family planning
- · So many children die in infancy that parents tend to produce more in hope that several will live.
- · Many children are needed to work on the land.
- · Children are regarded as a sign of virility.
- · Religious belief (e.g. Roman Catholics, Muslims and Hindus) encourage large families.
High death rates, especially among children, are due to:
- · Disease and plague (bubonic, cholera, kwashiorkor).
- · Famine, uncertain food supplies, poor diet.
- · Poor hygiene: no piped, clean water and no sewage disposal.
- · Little medical science: few doctors, hospitals, drugs.
Stage 2. Birth rates remain high, but death rates fall rapidly
to about 20 per 1000 people giving a rapid population growth.
The fall in
death rate results from:
- · Improved medical care: vaccinations, hospitals, doctors, new drugs and scientific inventions.
- · Improved sanitation and water supply.
- · Improvements in food production (both quality and quantity)
- · Improved transport to move food, doctors, etc.
- · A decrease in child mortality.
Stage 3. Birth rates fall rapidly, to perhaps 20 per 1000
people, while death rates continue to fall slightly (15 per 1000 people) to
give a slowly increasing population.
The fall in
birth rate may be due to:
- · Family planning: contraceptives, sterilisation, abortion and government incentives.
- · A lower infant mortality rate, therefore less needs to have so many children.
- · Increase industrialization and mechanization meaning fewer labourers are needed.
- · Increased desire for material possessions (cars, holidays, bigger homes) and less for large families.
- · Emancipation of women, enabling them to follow their own careers rather than being solely child bearers.
Stage 4. Both birth rates and death rates remain low,
fluctuating slightly to give a steady population.
Nowadays the
MEDCs (the more economically developed countries) have reached stage 4 (UK,
USA, and Spain). Meanwhile the more developed LEDCs have reached the 3 stage
(India, Mexico, Brazil, and the least developed remain al 2 stage (Chad,
Nigeria, Kenya).
It has been
notice that since the 1990s several MEDCs appear to be entering in a new and
fifth stage. This stage is where the birth rate is beginning to fall below the
death rate. It is predicted that, if this trend continue, countries entering
this stage will eventually see a natural decrease in their total population.
Saturday, November 05, 2016
THE WORLD POPULATION GROWTH

In this unit you will learn about the world population and its evolution through History.
The following video shows how population has grown since the year 1C.E. and what its evolution would be until the year 2050.
And if you click on the first image you will see The USA and World Population Clock, which shows how the world's population is growing just now.
You must know the meaning of the following terms:
- birth rate
- death rate
- natural increase
- infant mortality rate
- life expectancy
- birth control
- dependent population
- dependency ratio
- family planning
- population piramids/age-gender structures
- replacement rate
- fertility rate
- ageing population.
- population distribution and population density
- a more economically developed country (MEDC) and less economically developed country (LEDC)
- overpopulation and under population.
Subscribe to:
Posts (Atom)